

Why Odds Literacy Separates Informed Bettors from the Rest
Early in my betting career, I backed England at 5/4 to beat Australia in a T20 and felt clever about it. A friend had taken the same match at 2.30 decimal with a different bookmaker — and I genuinely didn’t realise we’d placed the exact same bet at fractionally different prices. I’d left money on the table because I couldn’t convert between odds formats quickly enough to spot the discrepancy. That gap in understanding cost me about three pounds on a twenty-pound stake. Multiply that by hundreds of bets across a season and you start to see why odds literacy isn’t a nice-to-have — it’s the foundation everything else rests on.
The UK cricket betting market generates approximately 52 million pounds annually, a 2.2% share of the country’s 2.37-billion-pound online sports betting sector. It’s a smaller market than football or horse racing, which means less attention from casual bettors and, in my experience, more opportunities for those who do their homework. But none of that homework matters if you can’t read the price on the ticket.
This article works through every layer of odds comprehension: the formats you’ll encounter, the mathematics underneath them, how bookmakers build their profit margin into the numbers, why cricket odds move before and during matches, and how to identify genuine value rather than just backing favourites. If numbers make you uncomfortable, I’ll do my best to keep the maths practical. Every formula here has a direct application to the next bet you place.
Fractional, Decimal and American: Three Formats, One Price
Walk into a betting shop in Birmingham and the odds are displayed as fractions. Open a European-facing sportsbook and you’ll see decimals. Browse an American exchange and suddenly you’re dealing with plus and minus signs. All three formats express the same information — the implied price of an outcome — but they do it differently enough that switching between them trips people up.
I spent my first two years betting exclusively in fractional odds because that’s what UK bookmakers default to. When I started using exchanges and comparing prices across international operators, learning decimal became non-negotiable. American odds I encounter less frequently for cricket, but they appear on certain platforms, so understanding all three keeps you flexible.
The key insight is this: odds are just a number that tells you two things simultaneously. How much you’ll win relative to your stake, and what probability the bookmaker is implying for that outcome. Every decision you make in cricket betting — whether to back, how much to stake, when to cash out — flows from understanding those two pieces of information.
Reading Fractional Odds (the UK Standard)
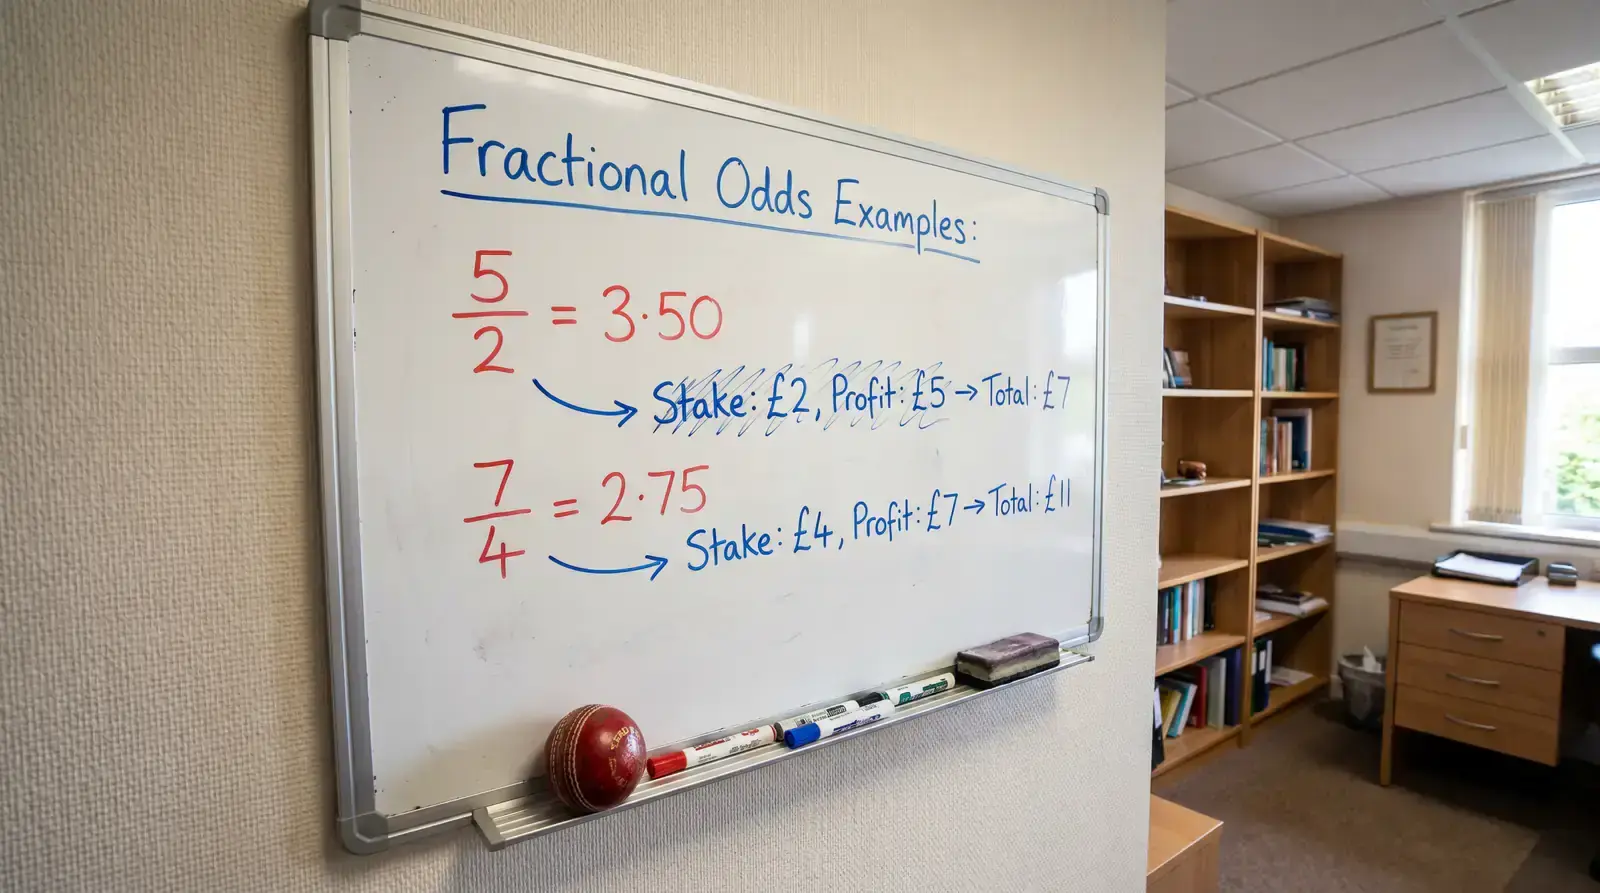
Fractional odds are Britain’s native format. When you see 5/2 next to India’s name in a Test match market, here’s what it means: for every 2 pounds you stake, you win 5 pounds in profit if the bet lands. Your total return would be 7 pounds — the 5 in profit plus your 2 stake back.
The formula is straightforward. Profit equals stake multiplied by the fraction. Total return equals profit plus the original stake. So a 10-pound bet at 7/4 gives you 17.50 in profit, and 27.50 total return. At evens — written as 1/1 or sometimes just “EVS” — you double your money. At odds-on prices like 4/9, you’re staking more than you stand to win, reflecting the market’s view that this outcome is more likely than not.
The fractions can look odd to newcomers. Odds like 11/8, 6/4, or 100/30 aren’t intuitive at first glance. A quick mental shortcut: divide the first number by the second to get your profit per pound staked. 11 divided by 8 is 1.375, so a pound bet at 11/8 returns 2.375 in total. Once you’ve internalised that division, reading fractional odds becomes second nature.
One thing that trips up beginners is “odds-on” pricing. When you see 4/7 or 2/5, the first number is smaller than the second — meaning you need to stake more than you’ll win in profit. At 4/7, a seven-pound stake returns four pounds profit plus the seven back, totalling eleven. These prices appear when the bookmaker considers an outcome more likely than not. In cricket, you’ll see odds-on favourites regularly in T20 matches where one side is dominant, or in Test matches where conditions heavily favour one team after the toss.
Decimal Odds and Quick Payout Calculation
Decimal odds tell you your total return per unit staked, including the stake itself. They’re the format used on most exchanges and by many European-facing sportsbooks, and frankly, they’re easier to work with for quick calculations.
If you see 3.50 next to a cricket team, a one-pound bet returns 3.50 in total — 2.50 profit plus your original pound. Comparing two prices is instant: 3.50 is a better price than 3.25. No fractions to reduce, no division in your head.
Converting between formats is simple. Decimal equals the fractional top number divided by the bottom number, plus 1. So 5/2 in fractional becomes (5 / 2) + 1 = 3.50 decimal. Going the other direction, subtract 1 from the decimal and express as a fraction. 2.75 decimal becomes 1.75, which is 7/4. Most sportsbooks let you toggle between formats in your account settings, but doing the conversion mentally keeps you sharp when comparing prices across different platforms.
Converting Odds to Implied Probability
This is where odds stop being just a payout calculator and become an analytical tool. Every set of odds implies a probability — the bookmaker’s assessment, baked into a number, of how likely an outcome is to happen.
The conversion from decimal odds to implied probability is one division: 1 divided by the decimal odds, multiplied by 100 to get a percentage. At decimal odds of 2.00, the implied probability is 50%. At 4.00, it’s 25%. At 1.50, it’s 66.7%. For fractional odds, the formula is: denominator divided by (numerator plus denominator), times 100. So 5/2 gives you 2 / (5+2) = 28.6%.
Why does this matter for cricket betting specifically? Because cricket is a sport where conditions, team composition, and format interact in complex ways that even experienced analysts disagree about. If you’ve done your research and believe England have a 45% chance of winning a particular T20, but the bookmaker’s odds imply only a 35% chance, that gap is potential value. Conversely, if the implied probability is 60% and you think the true probability is 50%, the odds are working against you even if the team wins.
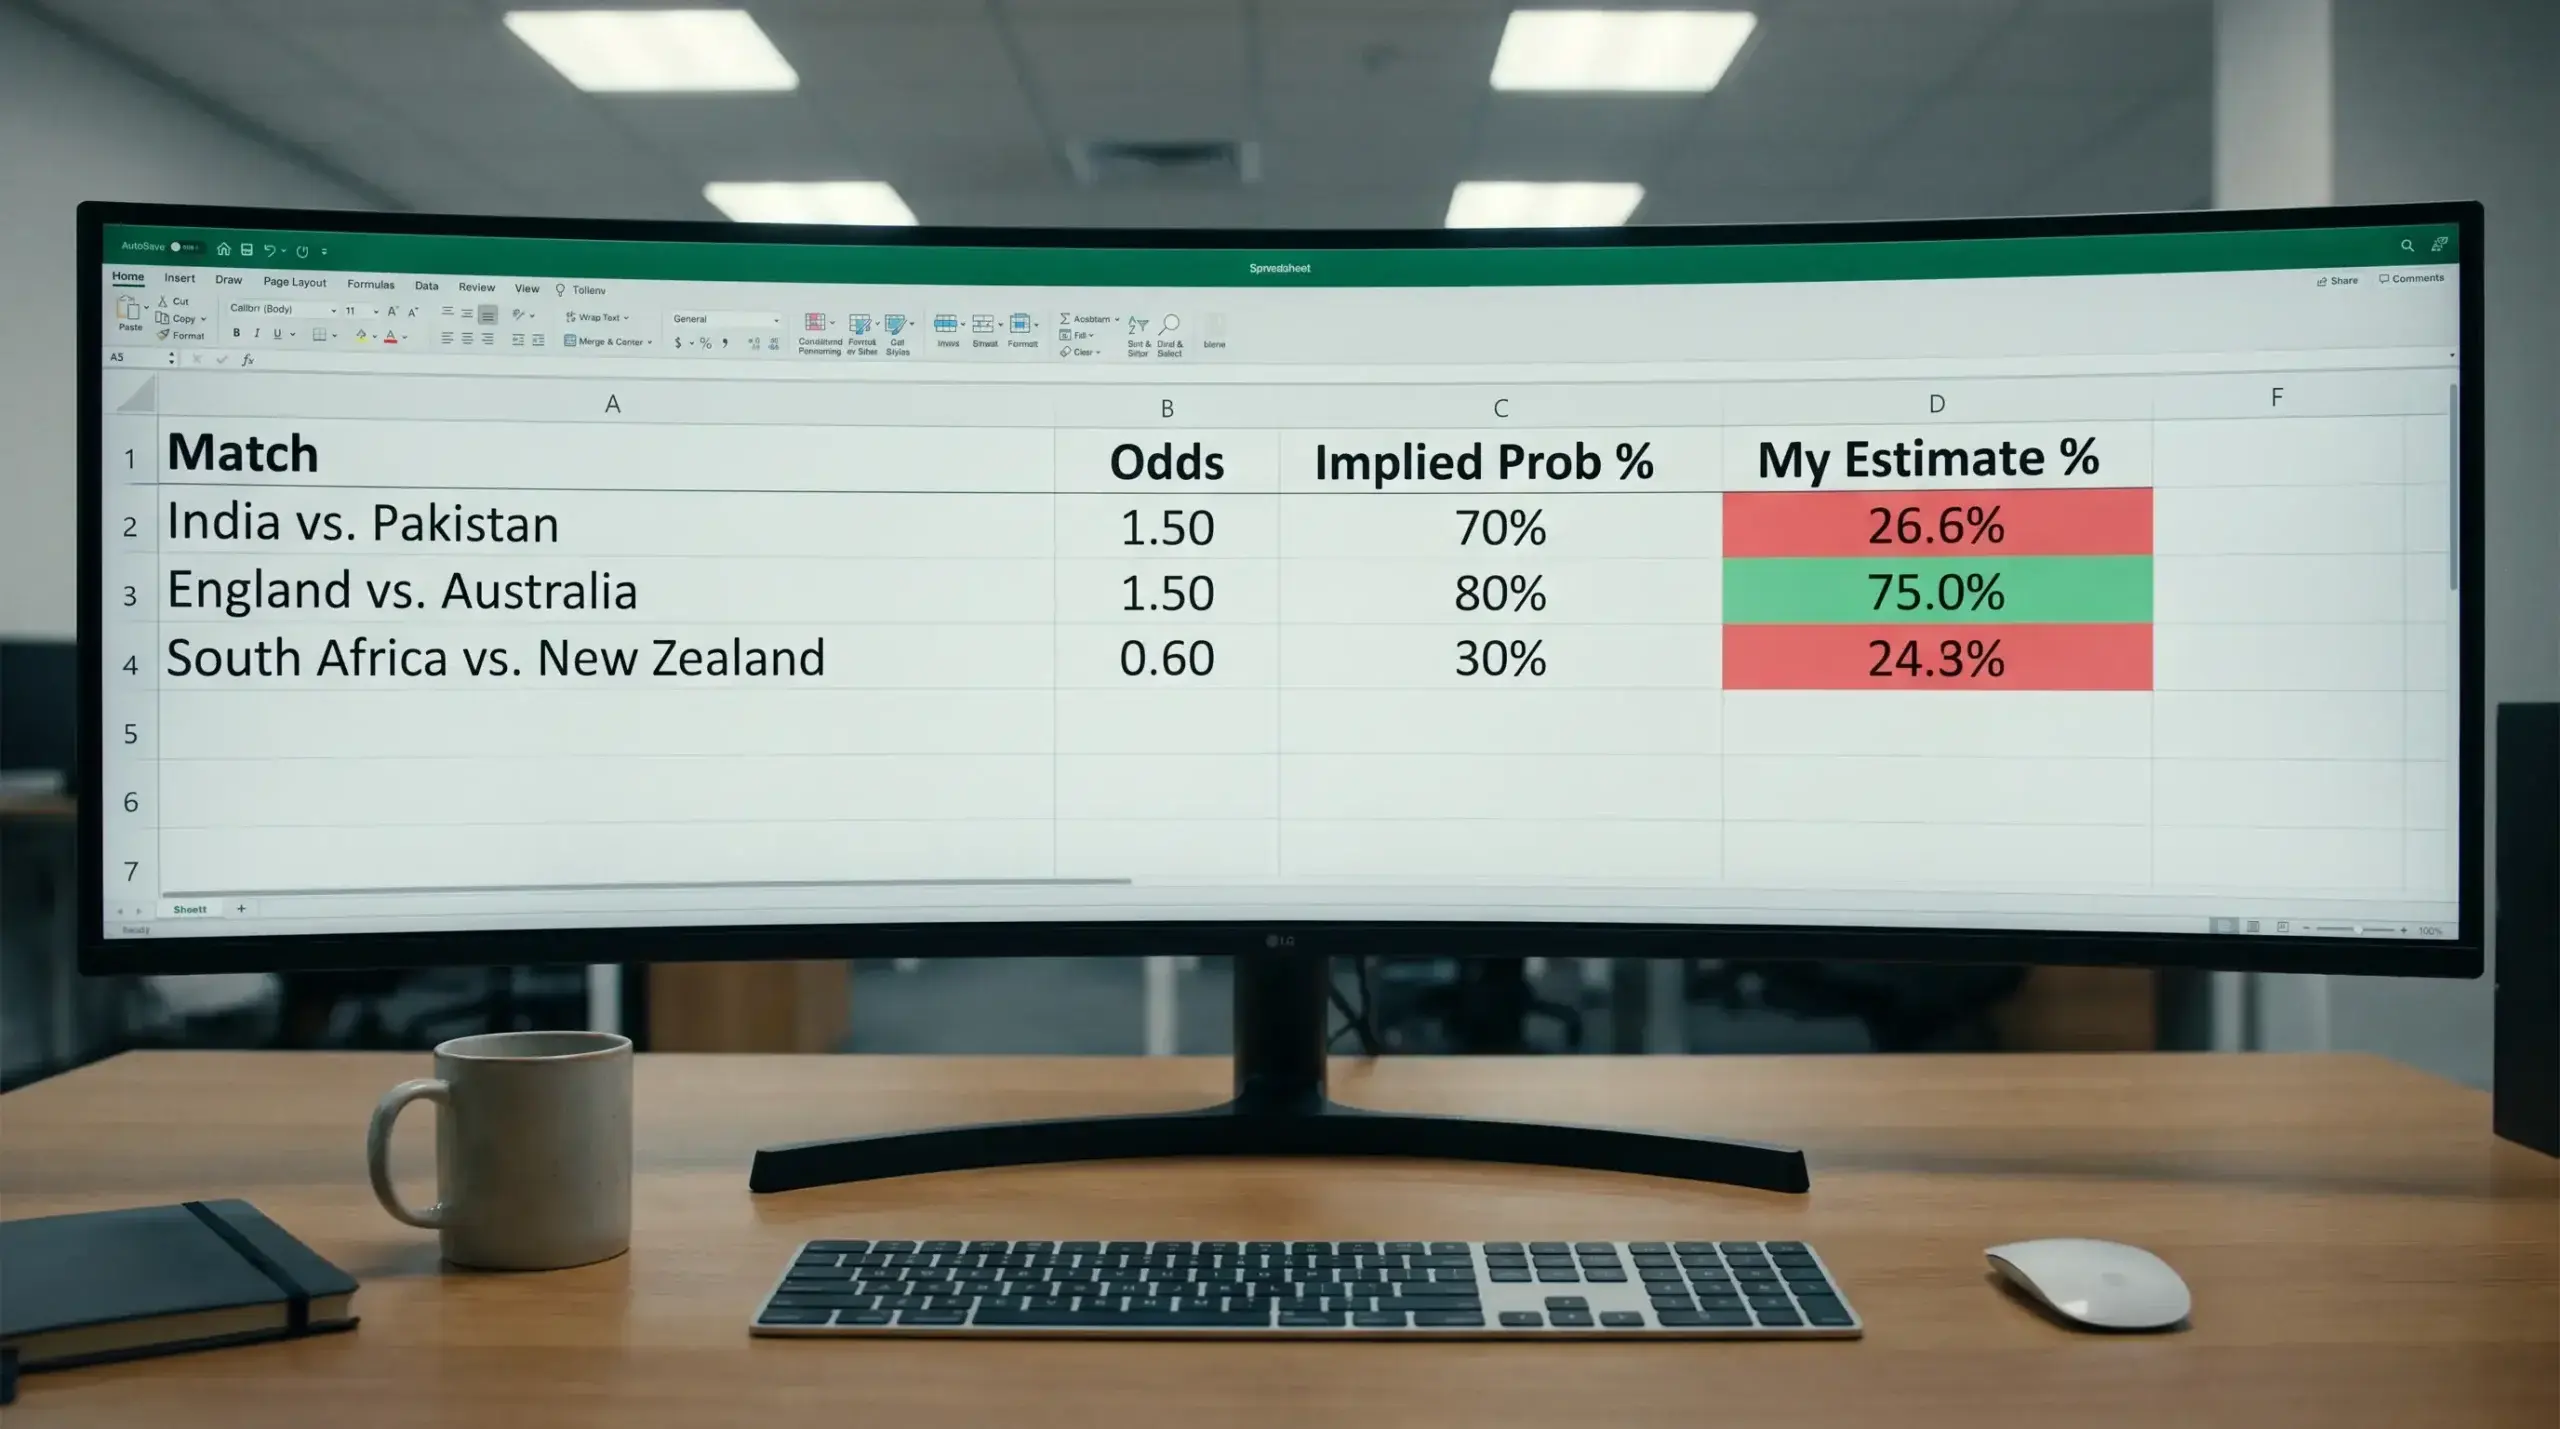
I keep a simple spreadsheet that converts every cricket bet I’m considering into implied probability, then compares it to my own estimated probability. The gap between those two numbers — what I call the “edge estimate” — determines whether I bet and how much I stake. Not every positive gap turns into a winning bet, obviously. But over hundreds of bets, consistently backing outcomes where your estimated probability exceeds the implied probability is the only reliable path to long-term profitability.
One caution: your probability estimates need to be honest. It’s very easy to convince yourself that a team has a higher chance than the market suggests simply because you want them to win. Separating analysis from fandom is the hardest discipline in cricket betting, and implied probability is the tool that forces you to confront the numbers rather than the narrative.
The Overround: How Bookmakers Build Their Margin
If you add up the implied probabilities of all outcomes in a market and they total exactly 100%, the bookmaker is offering “fair” odds with no margin. That never happens. In practice, the total is always above 100% — and that surplus is the overround, the bookmaker’s built-in profit.
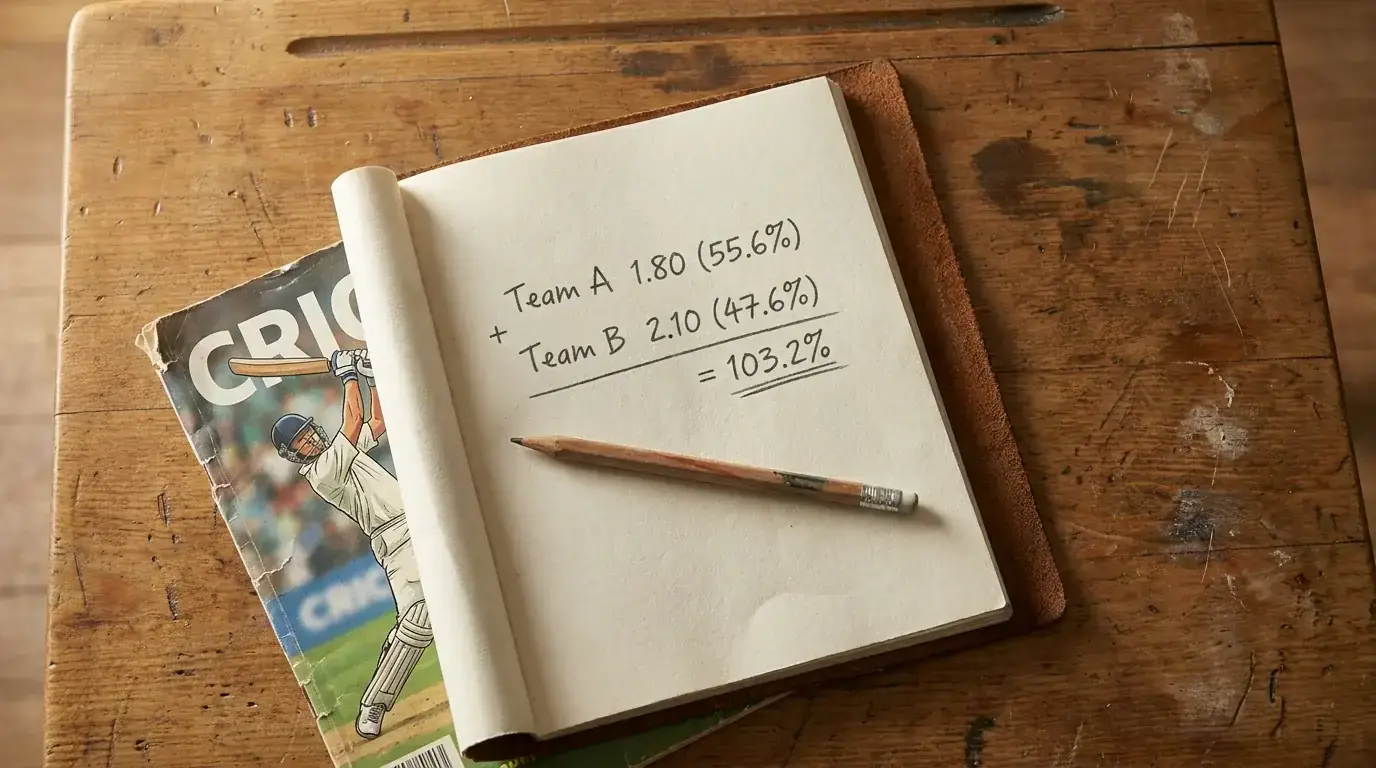
Take a hypothetical T20 match winner market with two outcomes. Team A is priced at 1.80 decimal (implied probability 55.6%) and Team B at 2.10 (implied probability 47.6%). Add those: 55.6% + 47.6% = 103.2%. That 3.2 percentage points above 100% is the overround. In effect, the bookmaker is “charging” you 3.2% for the privilege of placing the bet, distributed across both sides of the market.
Cricket overrounds vary by market type and match profile. High-profile internationals and IPL matches tend to have tighter margins — sometimes as low as 2-3% on match winner markets — because they attract more volume and bookmakers compete on price. Lower-profile fixtures, like a County Championship match or a bilateral ODI series between associate nations, often carry overrounds of 5-8% or higher. Player markets (top batsman, top bowler) and specials (method of dismissal, man of the match) typically run at wider margins still, sometimes exceeding 10%.
Why should you care? Because the overround directly affects your expected return. Betting into a market with a 10% overround means you need to be right more often, or at better prices, just to break even compared to a market with a 3% overround. Over time, seeking out lower-margin markets is one of the simplest ways to improve your results without changing your analysis at all.
Calculating the overround takes about twenty seconds. Convert each outcome’s odds to implied probability, sum them, subtract 100. The remainder is the bookmaker’s margin. I do this automatically now for every market I’m considering, and it regularly steers me away from markets where the margin makes it nearly impossible to find value — however good my analysis might be.
Why Cricket Odds Move and What It Signals
Last summer, I watched the odds on an England Test match shift from 2.40 to 1.90 in the space of forty minutes — before a ball had been bowled. The trigger was a single piece of news: Ben Stokes was confirmed fit and in the playing XI. That’s the thing about cricket odds movement. It’s rarely random noise. It almost always reflects new information entering the market.
Pre-match, the main drivers of odds movement are team selection, toss result, pitch report, and weather forecast. Late changes to a batting lineup or the inclusion of a previously doubtful fast bowler can move match winner odds by 10-15%. The toss, particularly in subcontinental conditions or day-night matches, regularly shifts prices. Weather forecasts that threaten rain in a Test match push the draw price shorter.
In-play, the movement is more dramatic and more frequent. Live betting accounts for roughly 55-60% of all cricket wagers placed in the UK, and those bets create continuous price adjustments. A cluster of early wickets in a T20 powerplay, a dropped catch, a bowling change that breaks a partnership — each event feeds into the algorithm that recalculates in-play odds, sometimes multiple times per over.
Reading odds movement is a skill that develops with observation. When you see a price shorten (odds getting lower, implying higher probability), ask what’s driving it. Is it genuinely new information, or is it weight of money from a large bet or a wave of public sentiment? Conversely, when a price drifts (odds getting longer), it might signal concerns you haven’t considered — an injury rumour, a pitch change, or simply sharp bettors moving away from that outcome.
I’ve learned to treat odds movement as a data source rather than a signal to follow. If a price shortens and my analysis already supported that team, it confirms my thinking but reduces the value available. If a price shortens and I disagree with the market’s reasoning, I might look at the other side. The market is often right, but it’s not always right, and the gap between market consensus and independent analysis is where profitable bets live.

Comparing Odds Across Bookmakers
I maintain accounts with four different bookmakers. Not because I enjoy managing passwords, but because the odds on the same cricket match can vary by 5-10% between operators — and over a year of regular betting, that difference adds up to a meaningful amount of money.
The global sports betting market is projected to reach over 325 billion dollars by 2035, and that growth has intensified competition between operators for market share. In the UK specifically, a single operator commands nearly 38% of advertising clicks in sports betting, but market dominance in advertising doesn’t translate to the best odds on every cricket market. Operators price their markets independently, influenced by their exposure, their customer base’s betting patterns, and their own risk models.
Odds comparison tools exist and they’re useful as a starting point. They aggregate prices from multiple bookmakers for the same market and let you see, at a glance, who’s offering the best number. For match winner markets on high-profile cricket fixtures, these tools are comprehensive. For niche markets — top batsman in a County Championship match, say, or total sixes in an IPL powerplay — coverage is spottier, and you may need to check individual operator sites manually.
The value of alternative pricing structures like spread betting becomes clearer once you’ve spent time comparing fixed-odds prices. Different mechanisms produce different edges depending on the situation.
Here’s the uncomfortable truth about the industry’s current trajectory, though. The UK’s recent tax increases on remote gaming — Remote Gaming Duty nearly doubling to 40% — have put enormous pressure on operators. Kevin Harrington, who heads Flutter Entertainment’s UK and Ireland business, warned that these changes would hand a significant advantage to unlicensed operators who don’t pay tax and don’t invest in safer gambling. If that prediction plays out, the competitive landscape for odds could narrow as regulated operators absorb costs by widening margins. Comparing prices becomes even more important in an environment where every operator is looking for ways to protect profitability.
My routine is simple: before placing any cricket bet above my minimum unit stake, I check the price at three bookmakers and on the exchange. If one of them is offering measurably better odds, that’s where the bet goes. It adds two minutes to the process and has improved my overall returns by a margin I can measure in my annual records.

Identifying Value in Cricket Match Odds
Value betting is the concept that separates recreational bettors from those who treat it as a long-term discipline. The idea is deceptively simple: bet when the odds offered are higher than the true probability of the outcome. In practice, identifying value consistently is the hardest thing in sports betting.
Consider a match where a bookmaker prices Team A at 2.50 decimal to win, implying a 40% probability. You’ve analysed the fixture — pitch, conditions, recent form, head-to-head record, team composition — and you estimate Team A’s actual win probability at 48%. That eight-percentage-point gap means the odds are offering you more than the outcome is “worth.” If your probability estimate is accurate, this is a value bet.
The critical word is “if.” Your estimate needs to be better than the bookmaker’s model, at least some of the time, for value betting to work. Bookmakers employ teams of traders and increasingly sophisticated algorithms to set cricket prices. They’re not perfect — particularly in less liquid markets like county cricket or early-season T20 franchise matches where data is thin — but they’re rarely wildly wrong on high-profile fixtures.
Where do value opportunities tend to appear in cricket? In my experience, three situations produce them more reliably than others. First, when significant new information hasn’t been fully priced in — a late team change, a toss result on a deteriorating pitch, or a weather shift that alters bowling conditions. Second, in markets where the bookmaker’s model is based on limited data, such as women’s cricket, associate nation matches, or new franchise tournaments. Third, in specific in-play scenarios where live odds are driven by the algorithm’s reaction to the last few balls rather than a considered assessment of the match state.
Value betting requires patience and record-keeping. You won’t know whether a single bet was “value” until you’ve placed hundreds of similar bets and can measure your results against the implied probabilities you were getting. A hit rate of 42% at average odds of 2.50 is profitable. A hit rate of 38% at the same odds is a loss. The margin between success and failure is thin, and only rigorous tracking reveals which side you’re on.
I track every bet in a spreadsheet with five columns: date, selection, odds taken, implied probability, and my estimated probability at the time of placing the bet. After each quarter, I compare my estimated probabilities against actual outcomes. If my calibration is off — if I’m consistently overestimating or underestimating certain types of outcomes — I adjust my process. This feedback loop is what turns value betting from a theory into a working method. Without it, you’re guessing about whether you’re guessing well.

The Odds Are the Starting Point, Not the Destination
Everything in cricket betting starts with the number next to a team’s name. But that number only becomes useful once you understand what it means, how it was constructed, where it might be wrong, and how to compare it against your own assessment. The bettors I know who sustain profitability over years aren’t the ones with the flashiest predictions — they’re the ones who can convert 7/4 to 2.75 without thinking, who know the overround on a market before they click into it, and who walk away when the price doesn’t offer value. Odds literacy isn’t glamorous. It’s just the thing that makes everything else possible.
